| Overview | Data | Maps | Software | Publications | News |
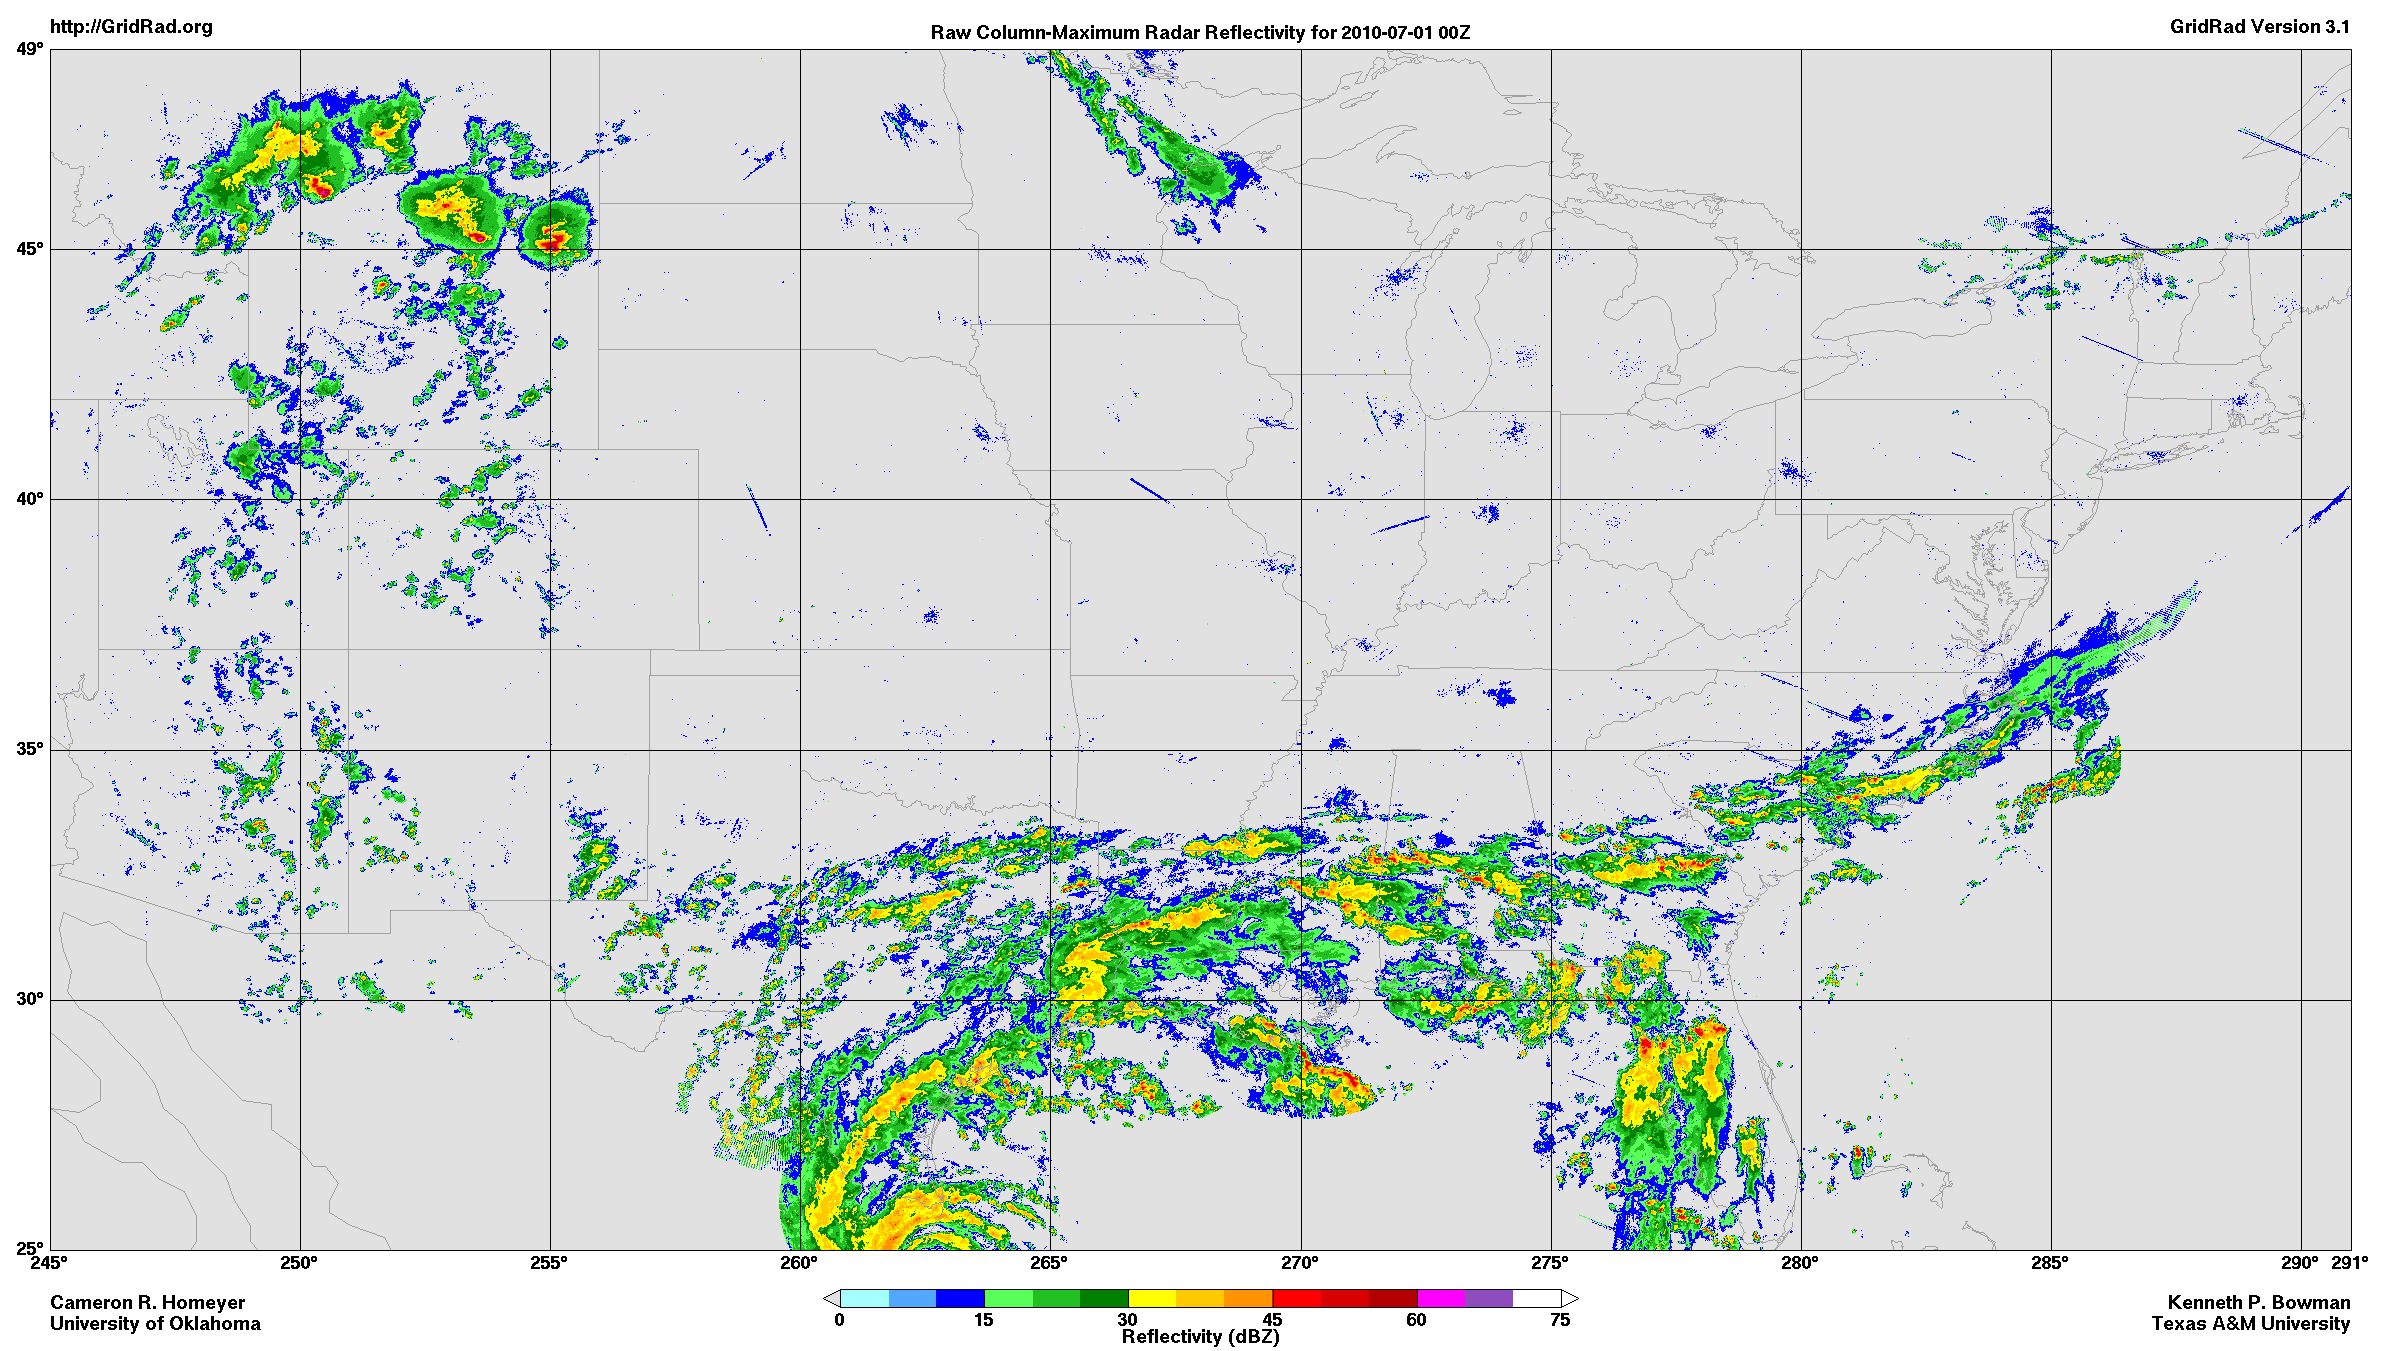
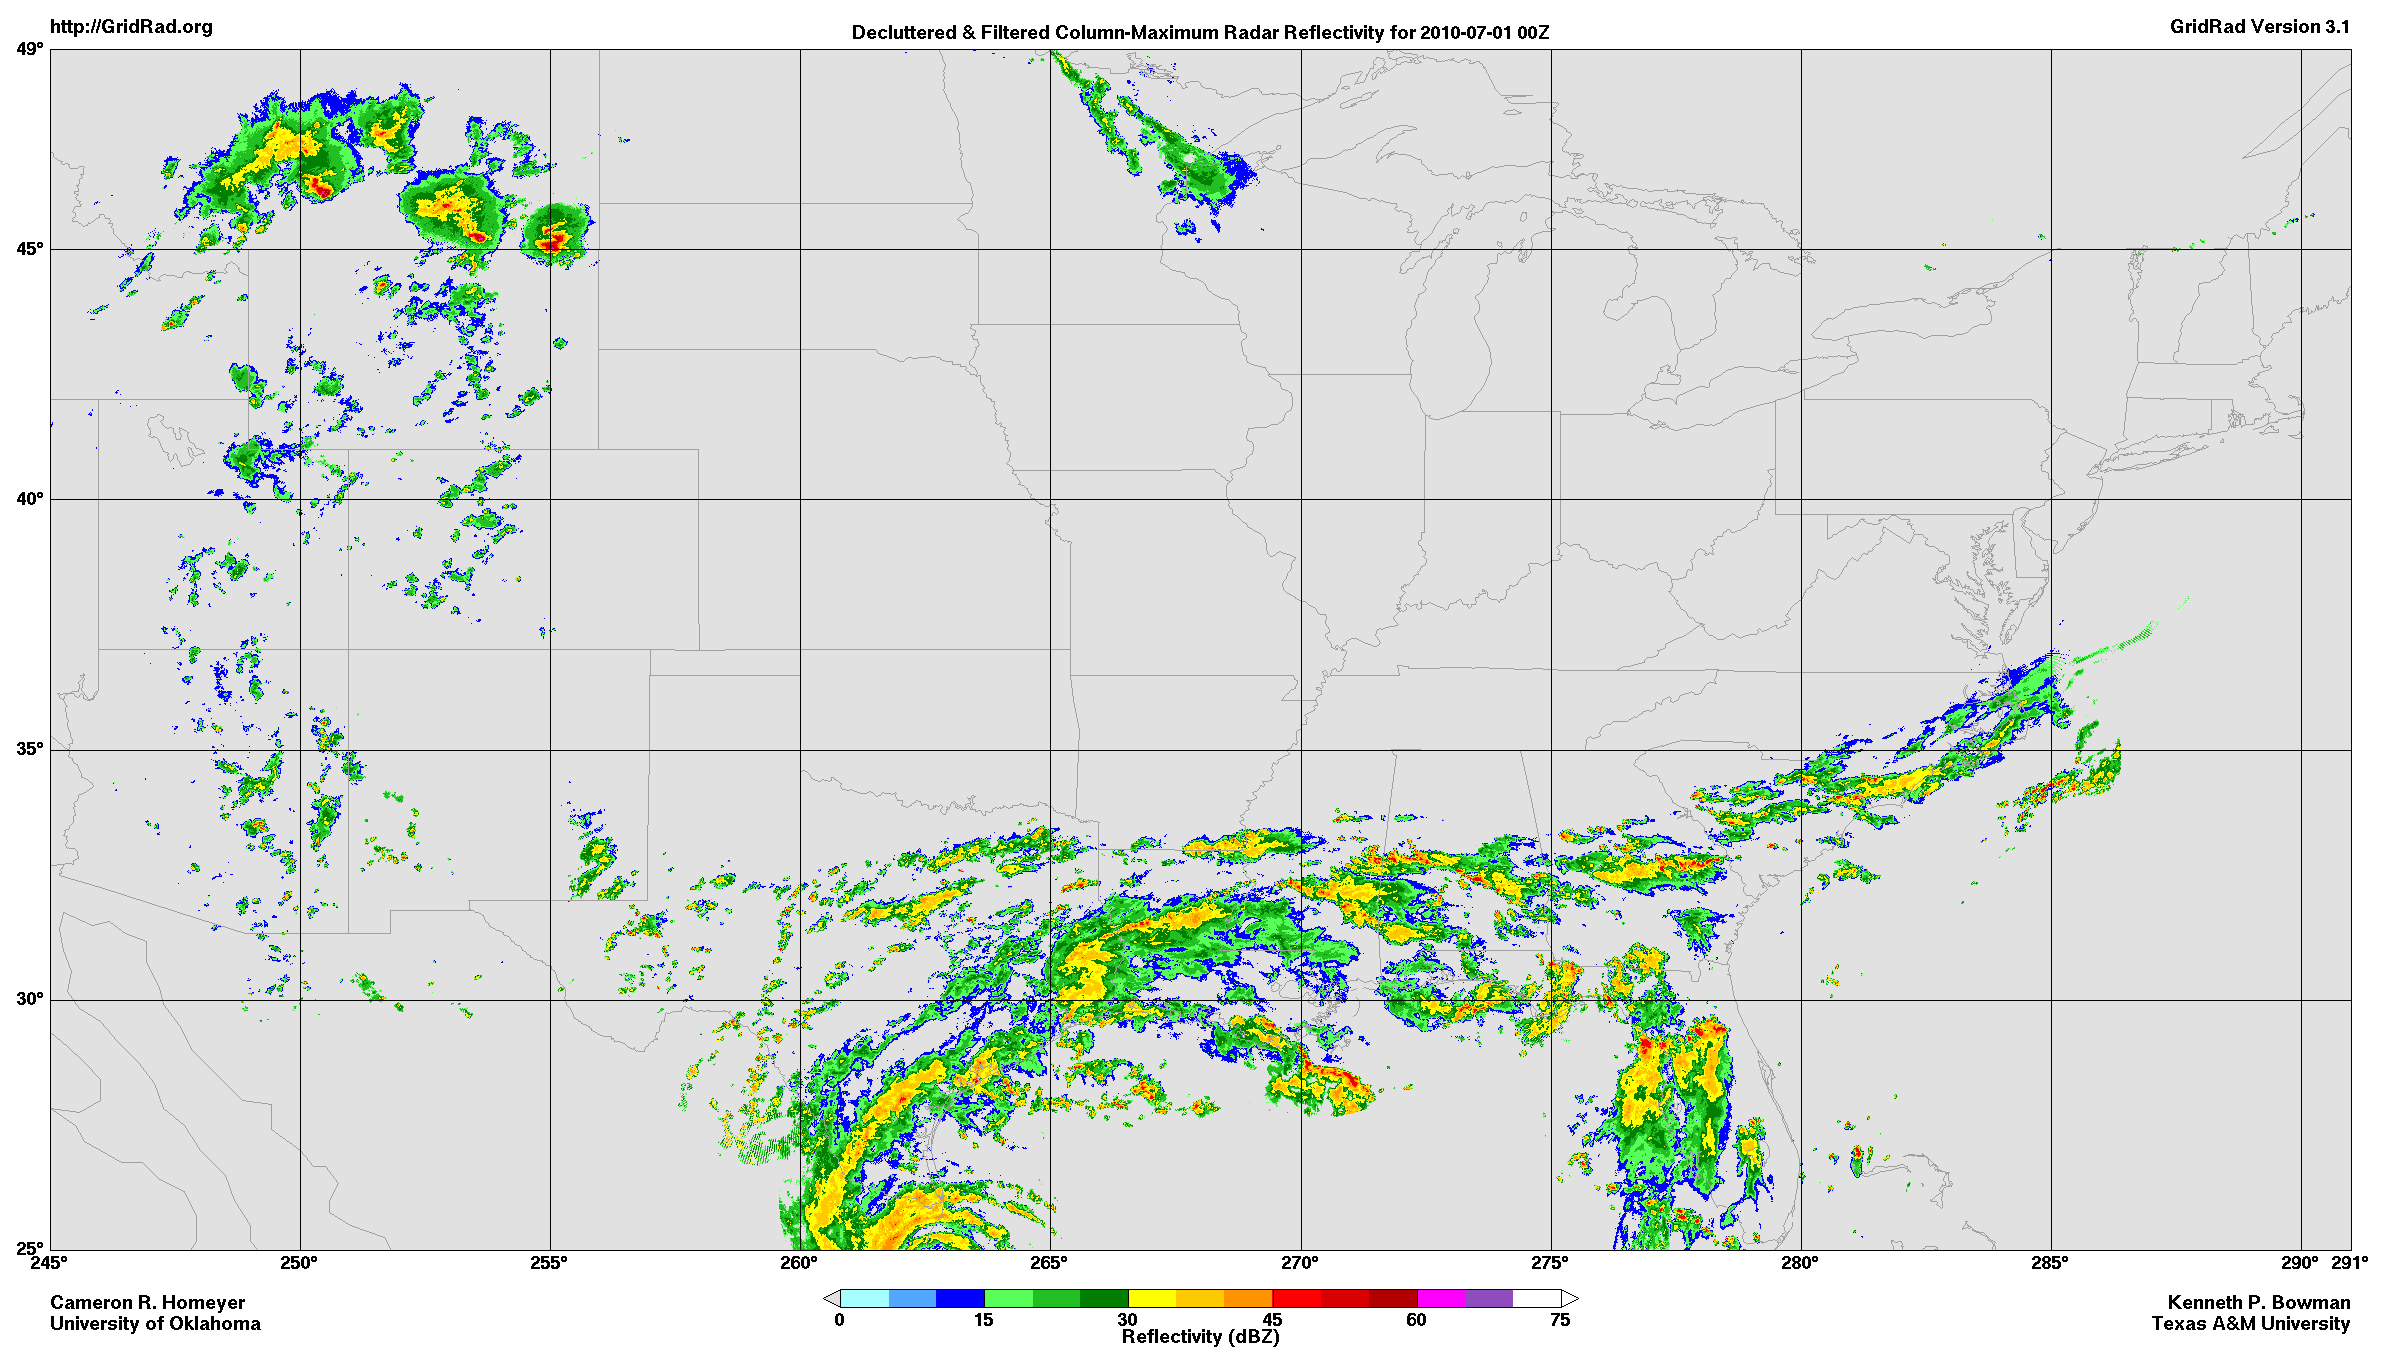
To allow browsing the V3.1 GridRad data, full-resolution radar reflectivity maps have been created for every analysis time. The maps show the maximum radar reflectivity observed in each vertical column and are similar to the real-time national radar mosaics from the National Weather Service. Click here for more examples of GridRad maps.
Two versions of the GridRad maps are available: raw and decluttered/filtered. Raw maps are created directly from the GridRad data files. Decluttered/filtered maps are processed to remove clutter and other artifacts. Because of the difficulty distinguishing meteorological signals from other echoes in many situations, the decluttering and filtering process may remove real precipitation, particularly light, shallow precipitation. Samples of each version are displayed below.
The maps are available as monthly and annual zip files containing PNG files. To download hourly maps for particular months or years, click the links below.