
| Overview | Data | Maps | Software | Publications | News |
Click on the links below to download IDL and Python programs to read the GridRad data files and perform basic filtering and decluttering operations.
Additional information about the filtering and decluttering programs is provided in the Algorithm Description Documents.
The IDL function GRIDRAD_READ_FILE returns a data structure containing the contents of the requested GridRad file.
IDL> gridrad = GRIDRAD_READ_FILE('nexrad_3d_v3_1_20100701T000000Z.nc', /VERBOSE)
% Compiled module: GRIDRAD_READ_FILE.
% Loaded DLM: NCDF.
Level 3 data read from nexrad_3d_v3_1_20100701T000000Z.nc in        1.0469980 s
IDL> help, gridrad
** Structure <183d808>, 21 tags, length=663261016, data length=663261004, refs=1:
   NAME            STRING    'GridRad analysis for 2010-07-01 00:00:00Z'
   X               STRUCT    ->  Array[1]
   Y               STRUCT    ->  Array[1]
   Z               STRUCT    ->  Array[1]
   Z_H             STRUCT    ->  Array[1]
   NOBS            BYTE      Array[2301, 1201, 24]
   NECHO           BYTE      Array[2301, 1201, 24]
   FILE            STRING    'nexrad_3d_v3_1_20100701T000000Z.nc'
   FILES_MERGED    STRING    Array[390]
   ANALYSIS_TIME   STRING    '2010-07-01 00:00:00Z'
   .
   .
   .
IDL> help, gridrad.x
** Structure <17a68e8>, 5 tags, length=9248, data length=9244, refs=2:
   VALUES          FLOAT     Array[2301]
   LONG_NAME       STRING    'Longitude'
   UNITS           STRING    'degrees East'
   DELTA           FLOAT         0.0200000
   N               LONG              2301
IDL> help, gridrad.z_h
** Structure <17999b8>, 9 tags, length=530592272, data length=530592268, refs=2:
   VALUES          FLOAT     Array[2301, 1201, 24]
   LONG_NAME       STRING    'Radar Reflectivity'
   UNITS           STRING    'dBZ'
   MISSING         FLOAT               NaN
   WVALUES         FLOAT     Array[2301, 1201, 24]
   WLONG_NAME      STRING    'Reflectivity Bin Weights'
   WUNITS          STRING    'dimensionless'
   WMISSING        FLOAT           0.00000
   N               LONG          66324024
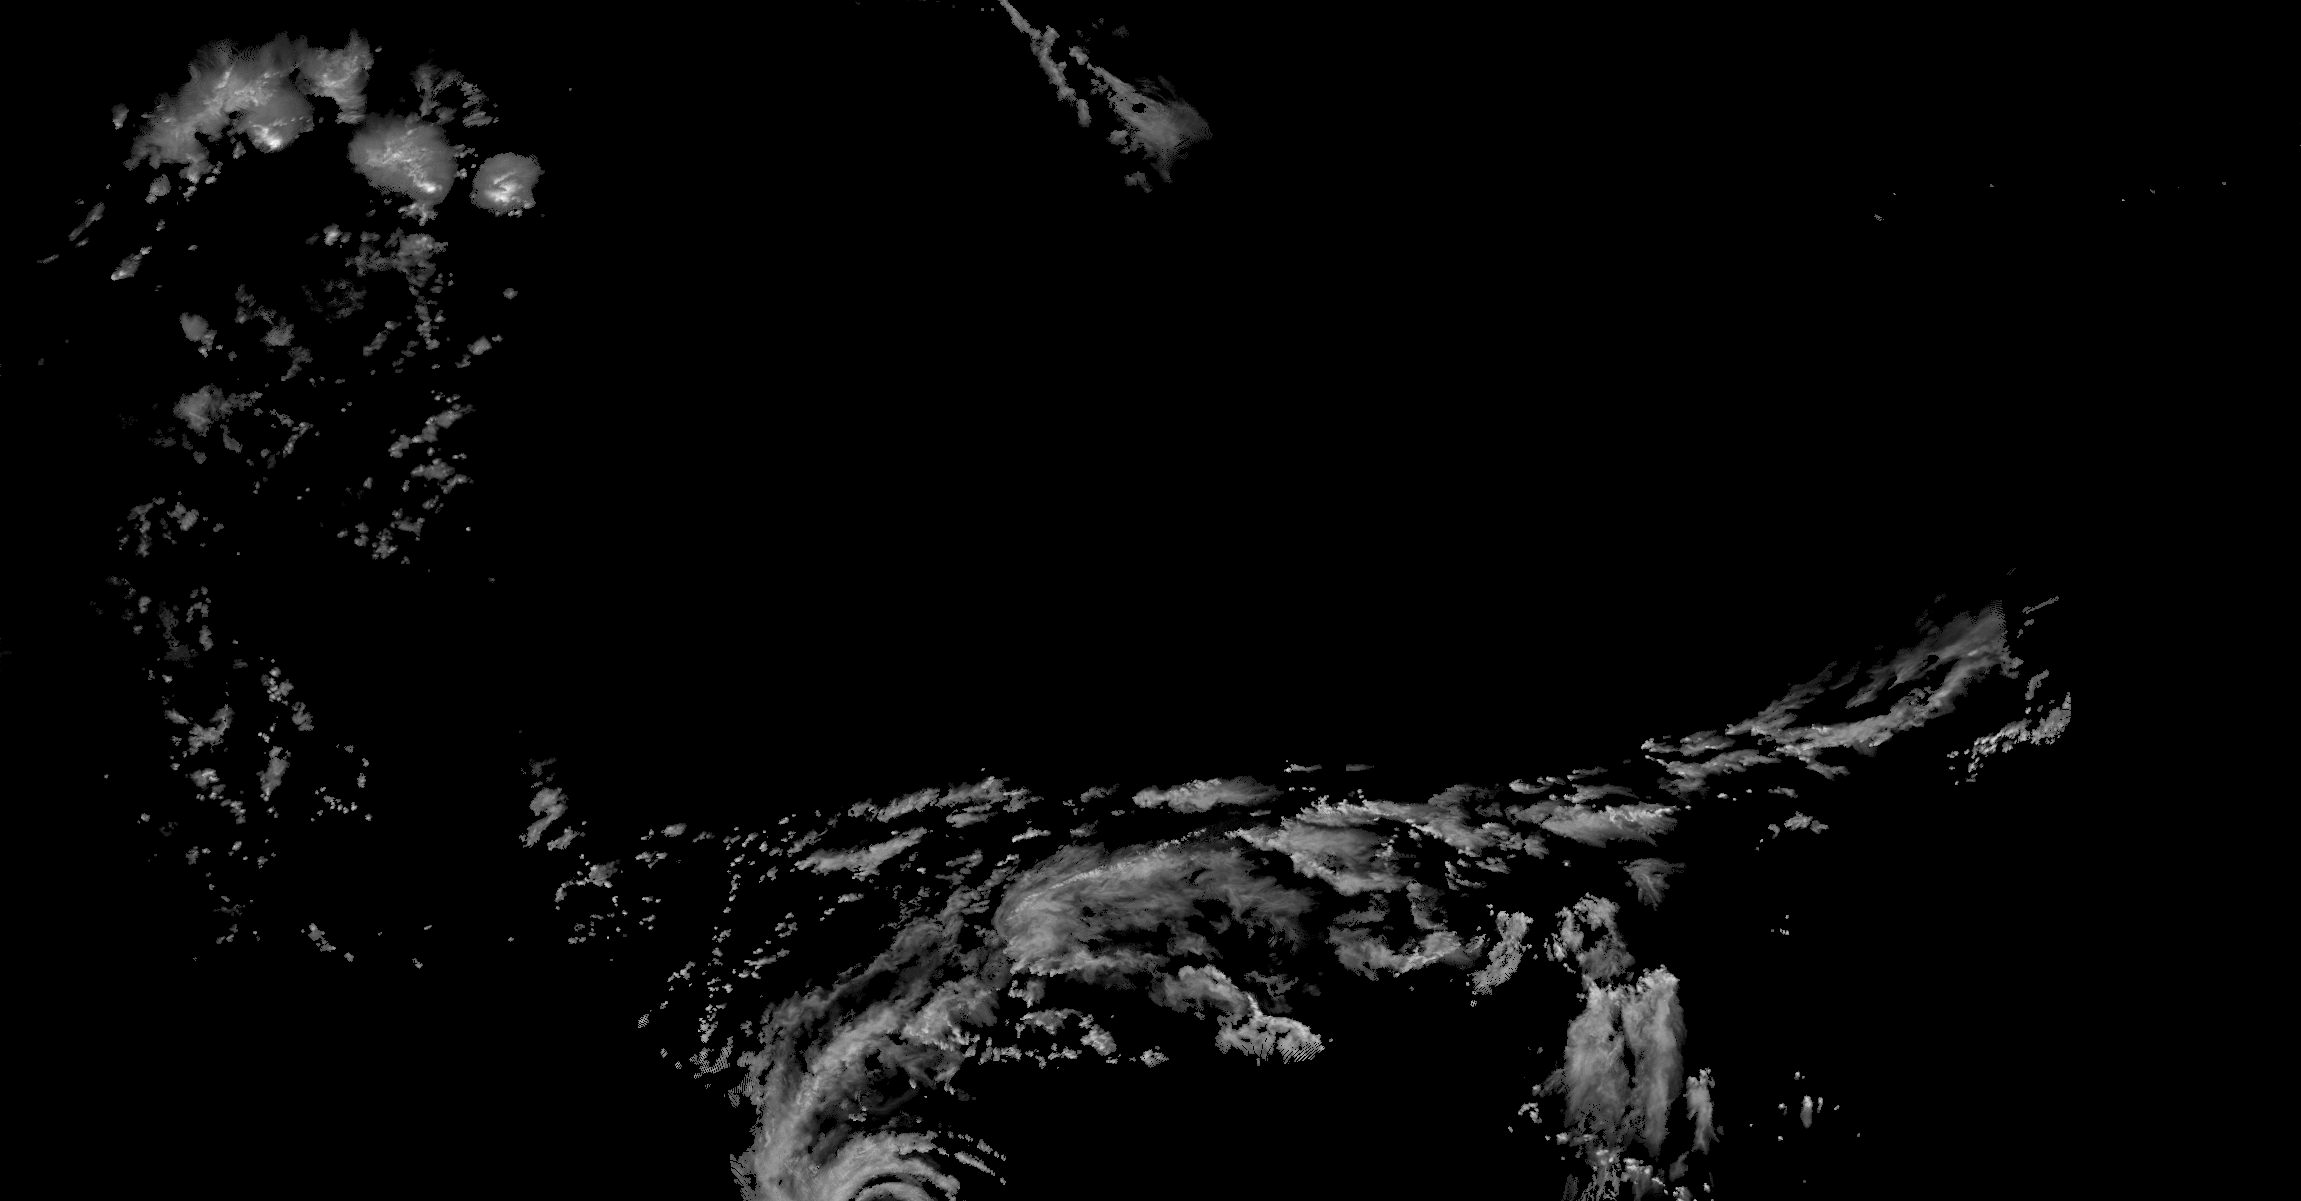
To make a quick grayscale plot of column-maximum reflectivity and save to a PNG file
IDL> window, xsize = gridrad.x.n, ysize = gridrad.y.n
IDL> tv, bytscl(max(gridrad.z_h.values, dim = 3, /nan), /nan)
IDL> write_png, 'gridrad_test.png', tvrd(true = 1)
The resulting unfiltered map looks like this.

To filter and declutter the data before plotting …
IDL> gridrad2 = GRIDRAD_FILTER(gridrad)
% Compiled module: GRIDRAD_FILTER.
IDL> gridrad3 = GRIDRAD_REMOVE_CLUTTER(gridrad2)
% Compiled module: GRIDRAD_REMOVE_CLUTTER.
% Compiled module: ARRAY_INDICES.
IDL> tv, bytscl(max(gridrad3.z_h.values, dim = 3, /nan), /nan)
IDL> write_png, 'gridrad_filtered_test.png', tvrd(true = 1)
The filtered map looks like this.
These quick maps can be compared with the raw and filtered maps for the same time on the Maps page.