
| Overview | Data | Maps | Software | Publications | News |
|
Analysis period Analysis interval Number of radars Longitude range Latitude range Altitude range Grid type Resolution Grid size Variables Repository DOI Last updated |
1995-01-01 00:00 UTC to 2017-12-31 23:00 UTC, all months 1 hour 125 115°W to 69°W 25°N to 49°N 1 to 24 km regular longitude-latitude-altitude 0.02° x 0.02° x 1 km 2301 x 1201 x 24 nradobs; nradecho; reflectivity NCAR Research Data Archive 10.5065/D6NK3CR7 2018-03-28 12:00 UTC [no longer in production] |
|
Analysis period Analysis interval Number of radars Longitude range Latitude range Altitude range Grid type Resolution Grid size Variables Repository DOI Last updated |
2008-04-01 00:00 UTC to 2021-08-31 23:00 UTC, April through August only 1 hour 143 125°W to 66°W 24°N to 50°N 1 to 22 km (0.5-km spacing from 1 to 7 km, 1-km from 7 to 22 km) regular spacing in longitude and latitude; variable spacing in altitude 1/48° x 1/48° x 0.5 or 1 km (0.020833...° x 0.020833...° x 0.5 or 1 km) 2832 x 1248 x 28 nradobs; nradecho; reflectivity; velocity spectrum width NCAR Research Data Archive 10.5065/Y463-4B15 2022-01-04 12:00 UTC |
|
Analysis period Analysis interval Number of radars Longitude range Latitude range Altitude range Grid type Resolution Grid size Variables Repository DOI Last updated |
2010 to 2022 (currently), ~100 events per year 5 min variable, up to 143 variable, up to 125°W to 66°W variable, up to 24°N to 50°N 0.5 to 22 km (0.5-km spacing from 0.5 to 7 km, 1-km from 7 to 22 km) regular spacing in longitude and latitude; variable spacing in altitude 1/48° x 1/48° x 0.5 or 1 km (0.020833...° x 0.020833...° x 0.5 or 1 km) 2832 (or fewer) x 1248 (or fewer) x 29 nradobs; nradecho; reflectivity; velocity spectrum width; azimuthal shear; radial divergence & for 2013 and later only: differential radar reflectivity; specific differential phase; correlation coefficient NCAR Research Data Archive 10.5065/2B46-1A97 2024-07-01 12:00 UTC |
|
Analysis periods Analysis interval Number of radars Longitude range Latitude range Altitude range Grid type Resolution Grid size Variables Repository DOI Last updated |
2021-06-01 00:00 UTC to 2021-08-31 23:55 UTC 2022-05-01 00:00 UTC to 2022-07-31 23:55 UTC 5 min 143 125°W to 66°W 24°N to 50°N 0.5 to 22 km (0.5-km spacing from 0.5 to 7 km, 1-km from 7 to 22 km) regular spacing in longitude and latitude; variable spacing in altitude 1/48° x 1/48° x 0.5 or 1 km (0.020833...° x 0.020833...° x 0.5 or 1 km) 2832 x 1248 x 29 nradobs; nradecho; reflectivity; velocity spectrum width NASA Atmospheric Science Data Center 10.5067/ASDC/DCOTSS-Radar-Satellite-Data_1 2022-10-12 18:00 UTC [no longer in production] |
Click here to download a sample GridRad file (~40 MB).
The GridRad data set consists of radar reflectivity data and radar coverage information from 125 U.S. NEXRAD WSR-88D radars merged onto a regular, three-dimensional, longitude-latitude-altitude grid at hourly synoptic analysis intervals. Each analysis uses all available radar azimuth scans within a specified time window centered on the analysis time (typically about +/-4 minutes). The size of the time window is stored in the GridRad files. Following conventional nomenclature, the NEXRAD volume scan files are referred to as Level 2 data, while the GridRad data sets are referred to as Level 3 data.
The GridRad data are stored as netCDF-4 files, one file per analysis time. A sample ncdump is available here. The reflectivity (Reflectivity) and reflectivity weight variables (wReflectivity) are stored using a sparse storage scheme to reduce file sizes. All of the dependent variables (i.e, excluding the coordinate variables) are stored using netCDF-4 gzip compression.
Note: The netCDF chunk size for 3-D (Nradobs and Nradecho) and indexed variables (index, Reflectivity, and wReflectivity) is set to the entire variable. Therefore, when reading these files the most efficient approach is generally to read the entire variable, rather than reading subarrays.
IDL and Python programs to read and quality control the GridRad data files are available on the Software page.
There are 365 days x 24 files per day = 8760 hourly analysis files for each year (8784 files for leap years).
The resolution of the analysis grid is 0.02° longitude x 0.02° latitude x 1 km altitude (~1.5 km x ~2 km x 1 km). The analysis domain covers most of the contiguous U.S. (CONUS), and extends from 245°E to 291°E (155°W to 69°W), 25°N to 49°N, and 1 to 24 km in altitude. The grid has 2301 x 1201 x 24 grid points (~66 million points).
The file naming convention is
nexrad_3d_vN_n_YYYYMMDDThhmmssZ.nc
For example, the file
nexrad_3d_v3_1_20040301T010000Z.nc
contains the GridRad Version 3.1 analysis for 2004-03-01 01:00:00Z.
For a small number of analysis times, no volume scans are available from the NEXRAD network. Reading the GridRad files for these times will return data arrays that are filled entirely with zeros for Nradobs, Nradecho, and wReflectivity, and entirely with NaNs for Reflectivity. The files_merged variable will contain the string: "No NEXRAD Level 2 volume scan files are available for this analysis time.". Click here to download a list of files with no valid data.
In the course of our research we have discovered a small number of analysis times with volume scans from individual radars that have gross errors. In the example below two radars (KVNX and KMTX) have obvious errors.
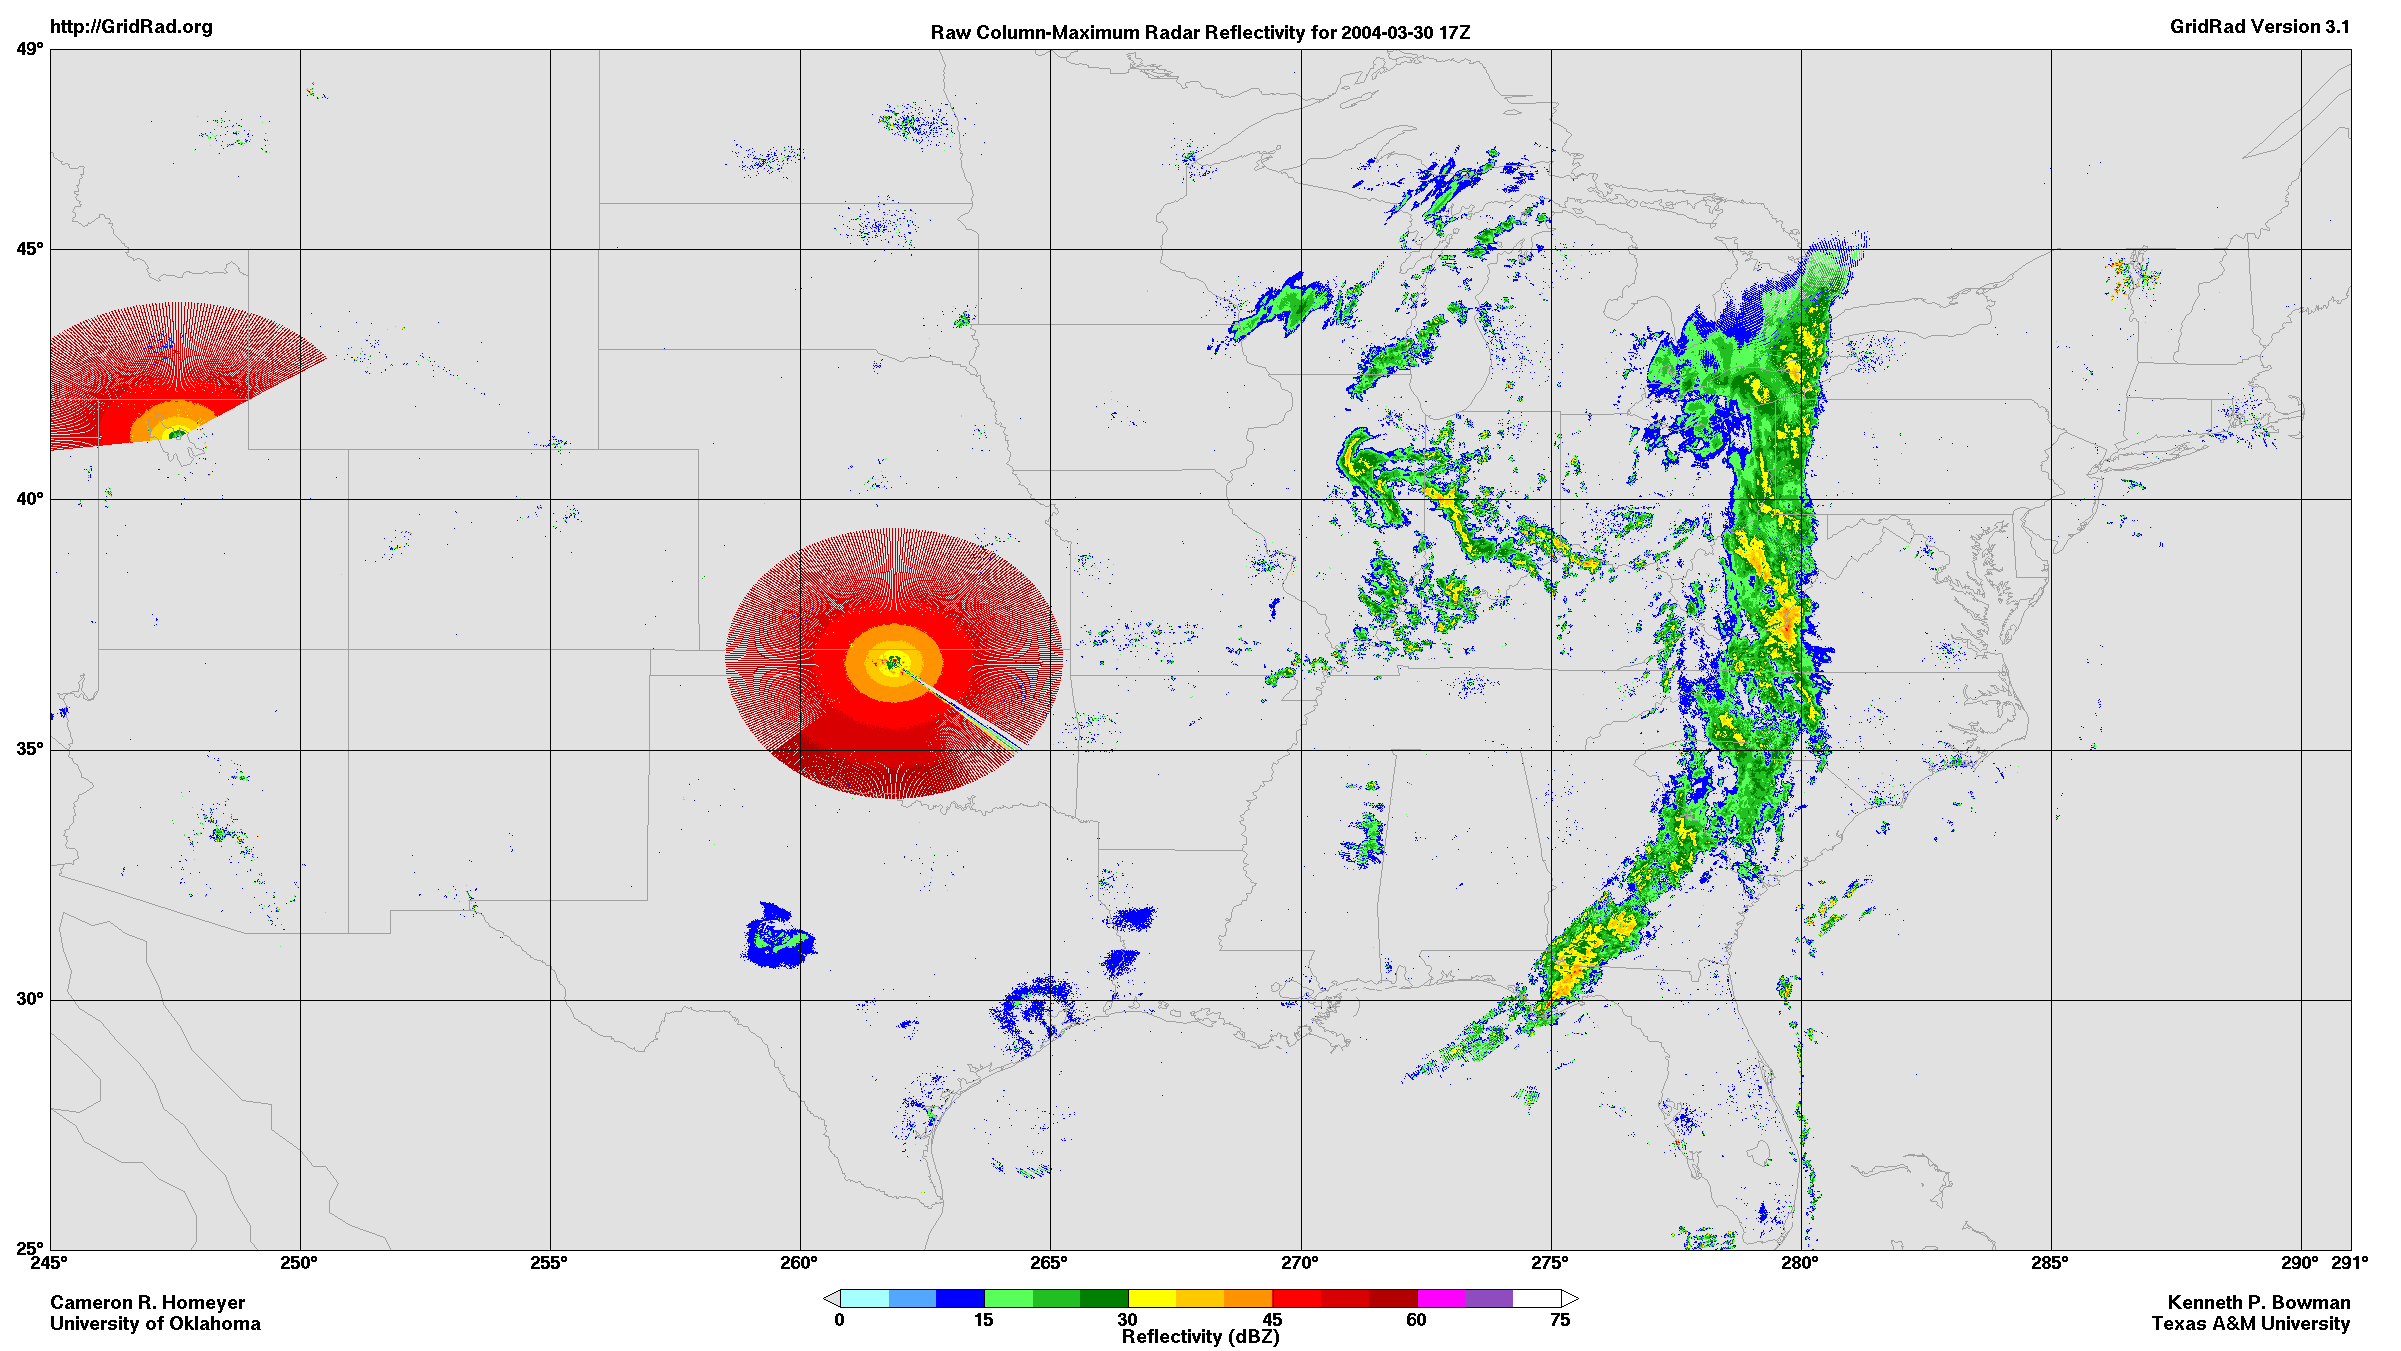
For this analysis time, we have re-merged the Level 2 data excluding the volume scans from those two radars. The result is shown below.
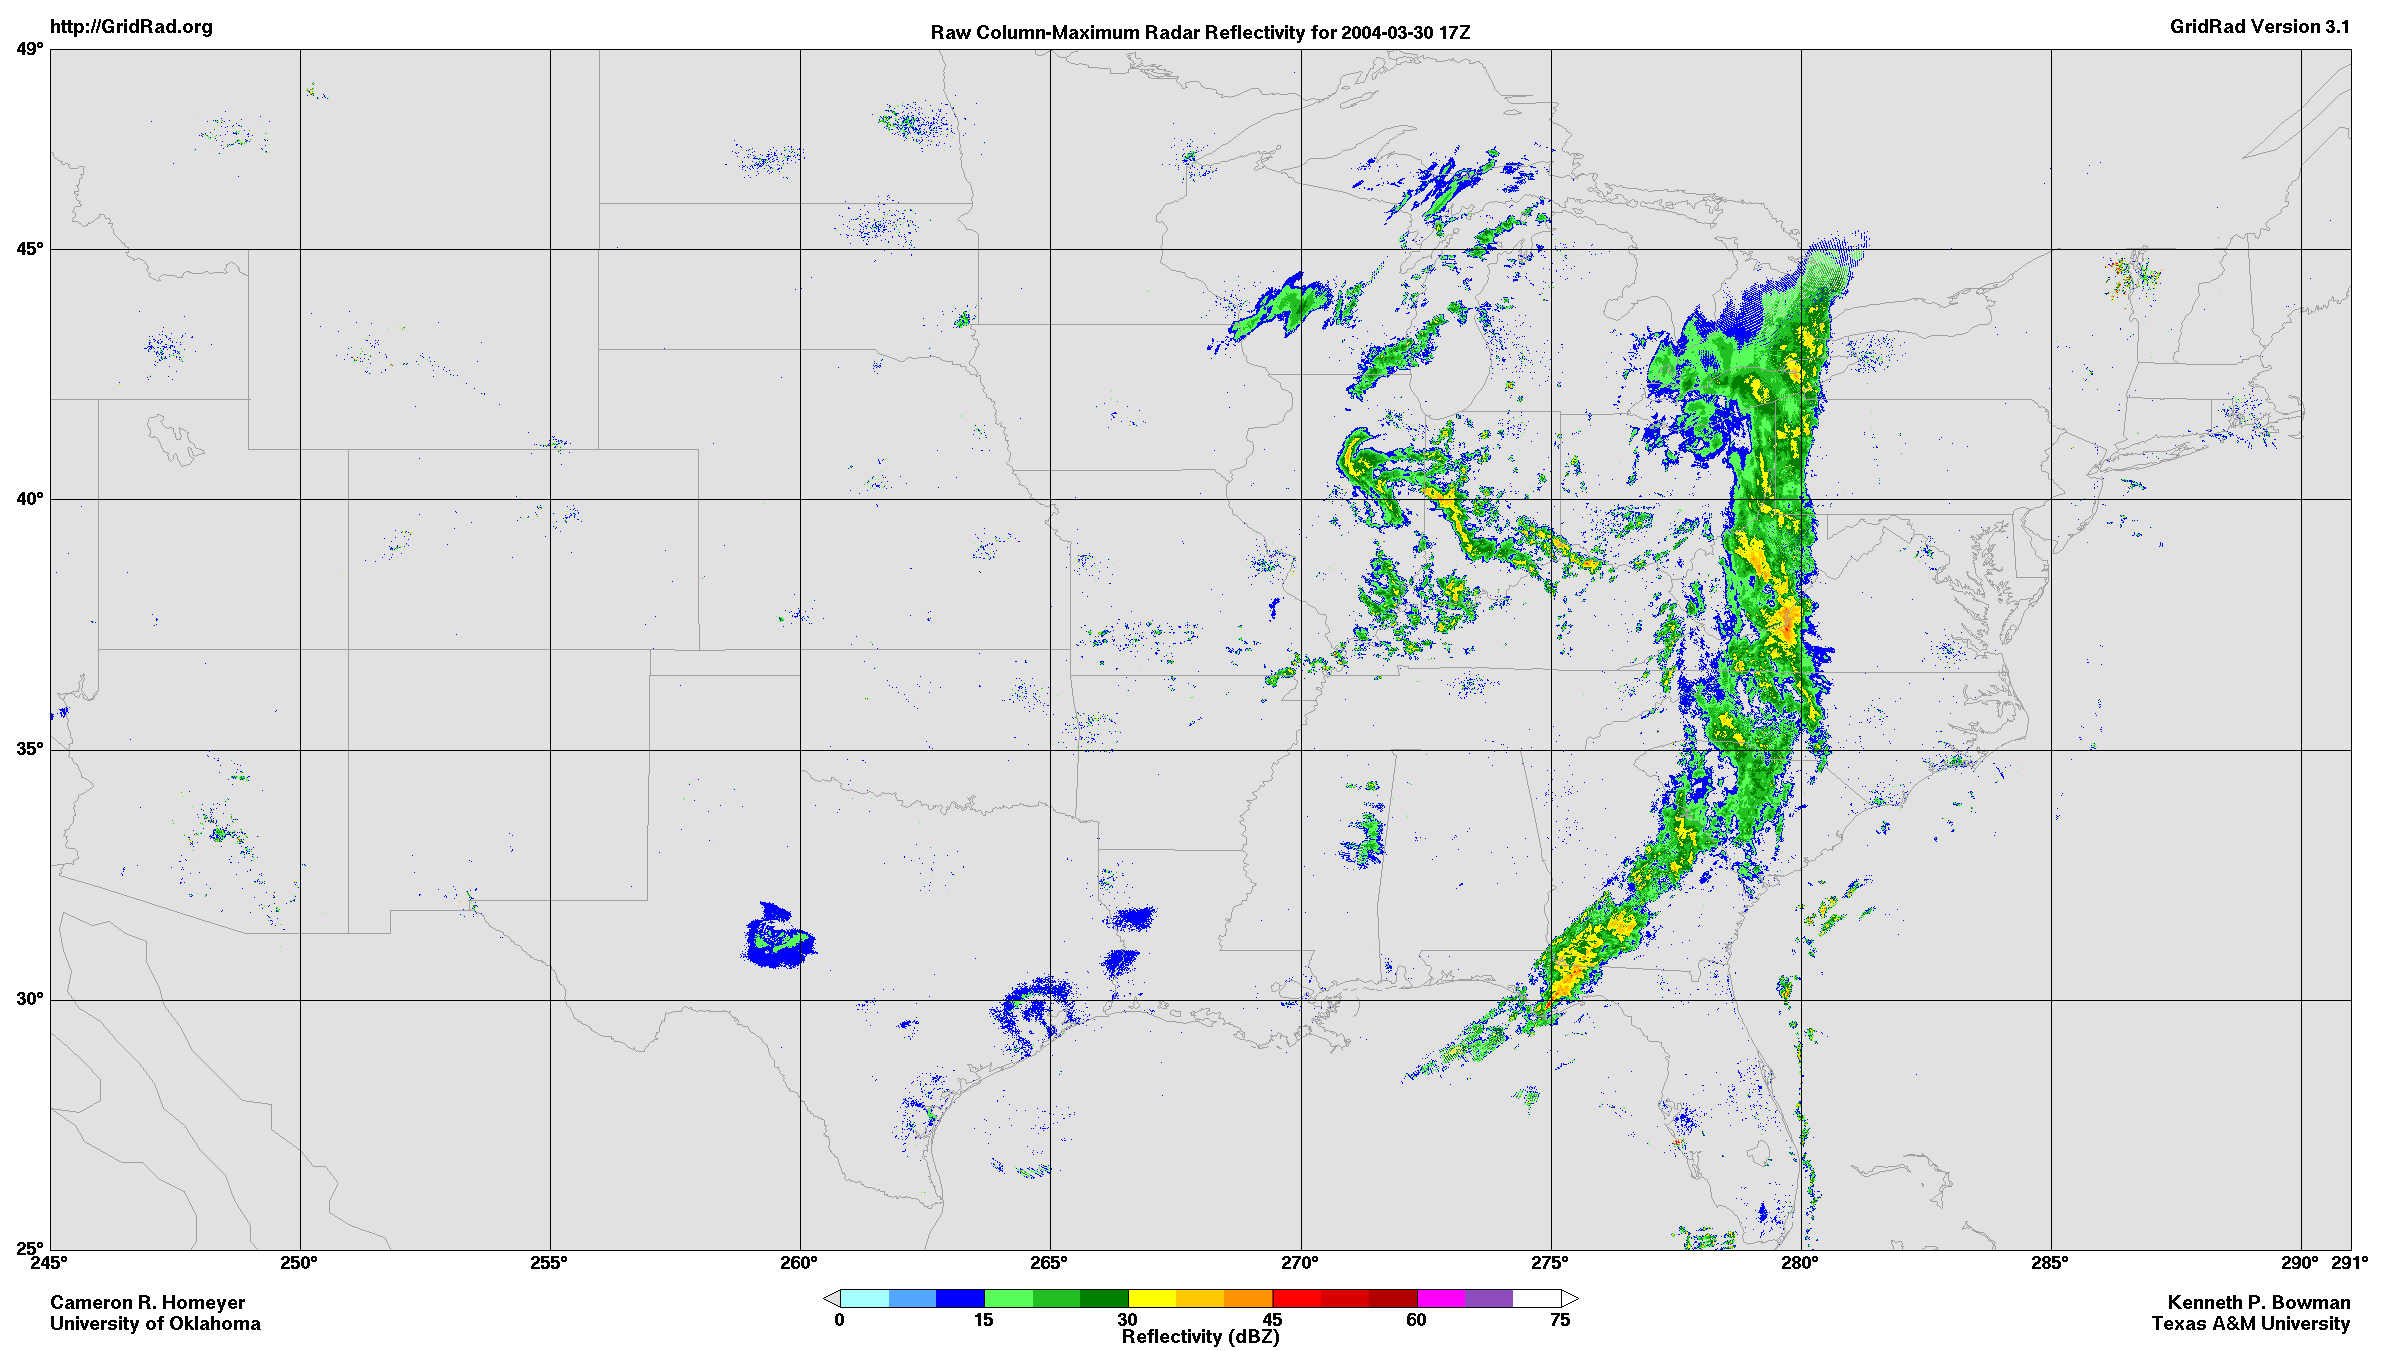
Click here to download a list of of the analysis times and radars with known bad volumes. In some cases the bad radar volume scans are not obvious in the reflectivity maps, but were identified by an echo-top height analysis.
The GridRad files for those analysis times have been processed excluding the listed radars. Note, however, that we have not conducted an exhaustive analysis of the data set, and individual analyses in the GridRad archive are known to contain bad volumes scans.
To download reflectivity maps with and without the bad volume scans, click here and here.