Last Update: 6 June 2019
GridRad_Viewer
INSTRUCTIONAL VIDEOS
Aside from the information provided in the HELP page accessible when running GridRad_Viewer, there are a handful of tips that we find to be useful for the inexperienced user. These are summarized in the (relatively) short narrated videos provided below.
1. Getting Started (length: 4 min, 16 s)
2. Generating Graphics (length: 3 min, 49 s)
3. Customizing Graphics (length: 8 min, 50 s)
4. Animations and Batch Output (length: 10 min, 58 s)
5. 3-D Visualizations (length: 4 min, 36 s)

HOW GRAPHICS ARE MADE
Maps and vertical cross-sections are created as images in GridRad_Viewer. This choice helps to keep the output files small relative to alternatives from contouring procedures. However, the images generated are similar in appearance to that generated by contouring due to an interpolation of the GridRad data to a finer spatial resolution.
Map Types
Column-Maximum - the maximum finite value of the chosen GridRad variable within each grid column.
Column-Minimum - the minimum finite value of the chosen GridRad variable within each grid column.
Constant Altitude - the values of the chosen GridRad variable at a single altitude level.
Echo Top - the maximum altitude at which the GridRad radar reflectivity at horizontal polarization ZH exceeds a specified threshold value, provided the next two lowest GridRad altitude levels also contain echo.
Storm Labeling in 3D (SL3D) - output from the SL3D (pronounced 'sled') echo classification algorithm described in Starzec et al. 2017 (doi:10.1175/MWR-D-16-0089.1).
VIL Density - the vertically integrated liquid (VIL) density, determined by computing VIL in each column using the GridRad radar reflectivity at horizontal polarization ZH in units of mm6 m−3 (VIL = ∑ 3.44x10⁻³*[ZH(z)(4/7)]*Δz, units of g m−2) and scaling (dividing) by the depth of echo (sum of 1-km altitude levels with ZH ≥ 18.5 dBZ).
Max Estimated Hail Size (MEHS) - the values given by the maximum estimated hail size model described in Witt et al. 1998 (doi:10.1175/1520-0434(1998)013<0286:AEHDAF>2.0.CO;2). This is computed using GridRad radar reflectivity at horizontal polarization ZH and a seasonally and latitudinally varying 0°C and −20°C altitude climatology over the US based on 10 years of radiosonde observations (2001-2010). Tables listing the coefficients of the radiosonde climatology are provided here.
Z-R Precipitation Rate - precipitation rates computed via application of a power-law relationship of the form
ZH = a*Rb (where ZH is converted to units of mm6 m−3 in this case). Separate Z-R relationships are used for convective and stratiform regions classified by the SL3D algorithm, with modification of the corresponding a & b coefficients possible on the CUSTOMIZATION tab of GridRad_Viewer. Precipitation rates are calculated using ZH at the lowest altitude where echo is observed in the 1-3 km layer of each grid column.
Polarimetric Precipitation Rate - precipitation rates computing via application of the power law relationship defined in Equations 13-15 in Ryzhkov et al. 2005 (doi:10.1175/JAM2213.1). Similar to the previous Z-R approach, precipitation rates are calculated using the polarimetric variables at the lowest altitude where echo is observed in the 1-3 km layer of each grid column. Note: this option is not possible using ZH-only data from the hourly GridRad archive.
Implied Ascent - positive values of vertical velocity (ascent) implied within each GridRad column of radial divergence DIV. Note: this option is not possible using ZH-only data from the hourly GridRad archive.
Coverage - No. Contributing Obs. - the total number of NEXRAD WSR-88D Level 2 observations binned into GridRad volumes within each grid column. Values ≥ 60 generally represent a well-sampled grid column.
Coverage - Min. Alt. Obs. - the minimum altitude observed by contributing NEXRAD WSR-88D radars within each grid column.
Coverage - Max. Alt. Obs. - the maximum altitude observed by contributing NEXRAD WSR-88D radars within each grid column.
Would you like to see something added to GridRad_Viewer? If so, please send requests along with ample detail and/or supporting information to Cameron Homeyer (chomeyer@ou.edu).
EXAMPLE GRAPHICS
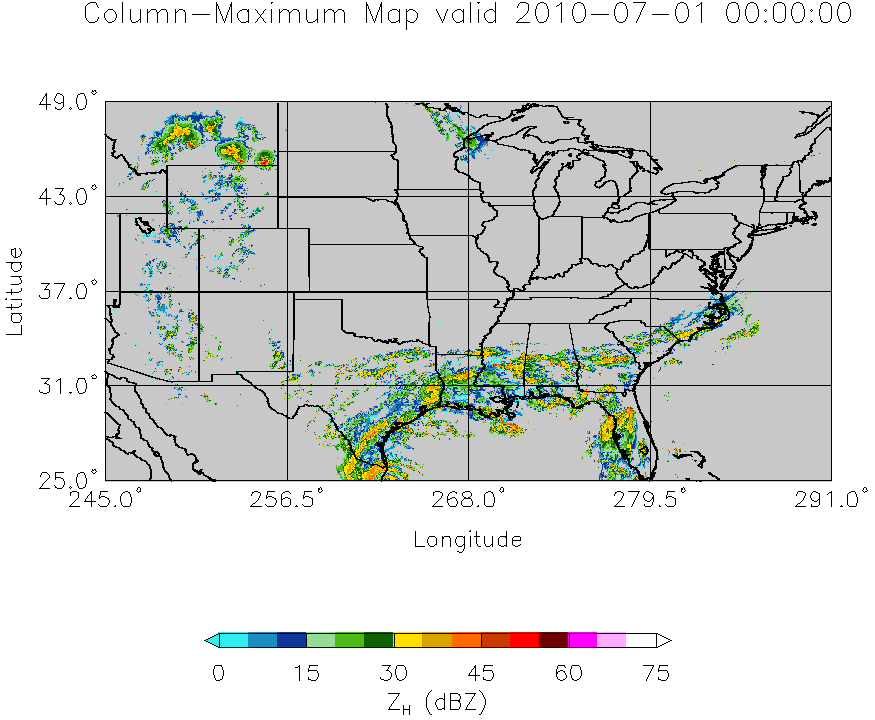
Column-maximum ZH maps valid 1 July 2010 at 00:00 UTC
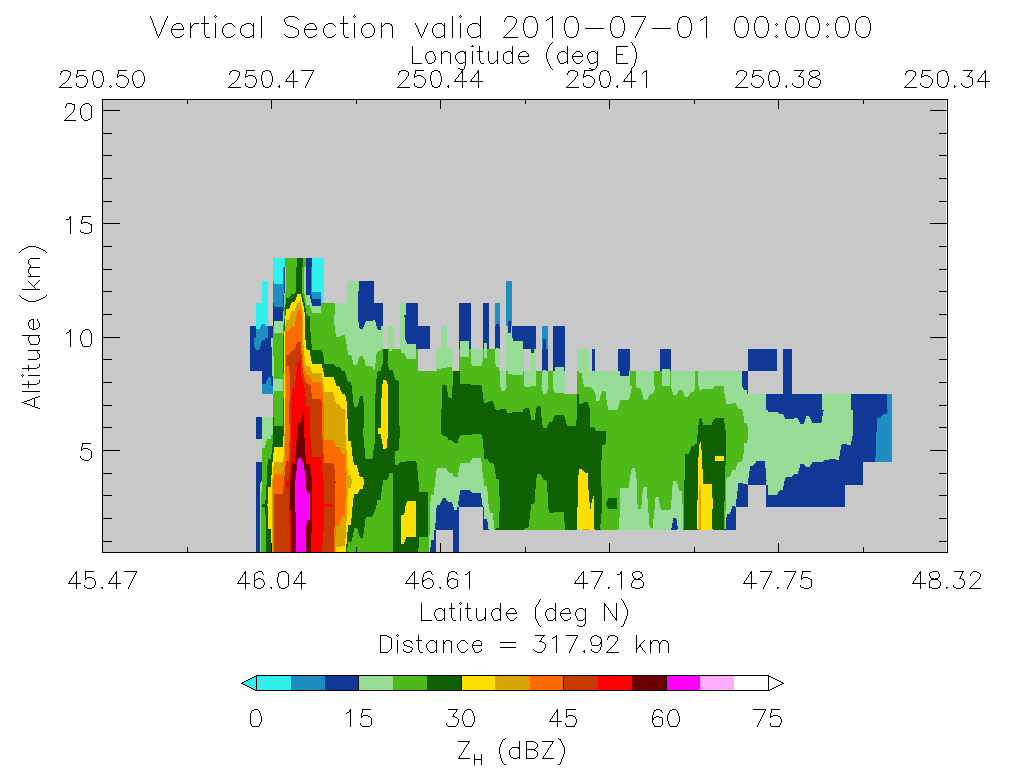
Vertical cross-section of ZH from 1 July 2010 at 00:00 UTC
Animation of column-maximum ZH from 00:00-23:00 UTC on 1 July 2010
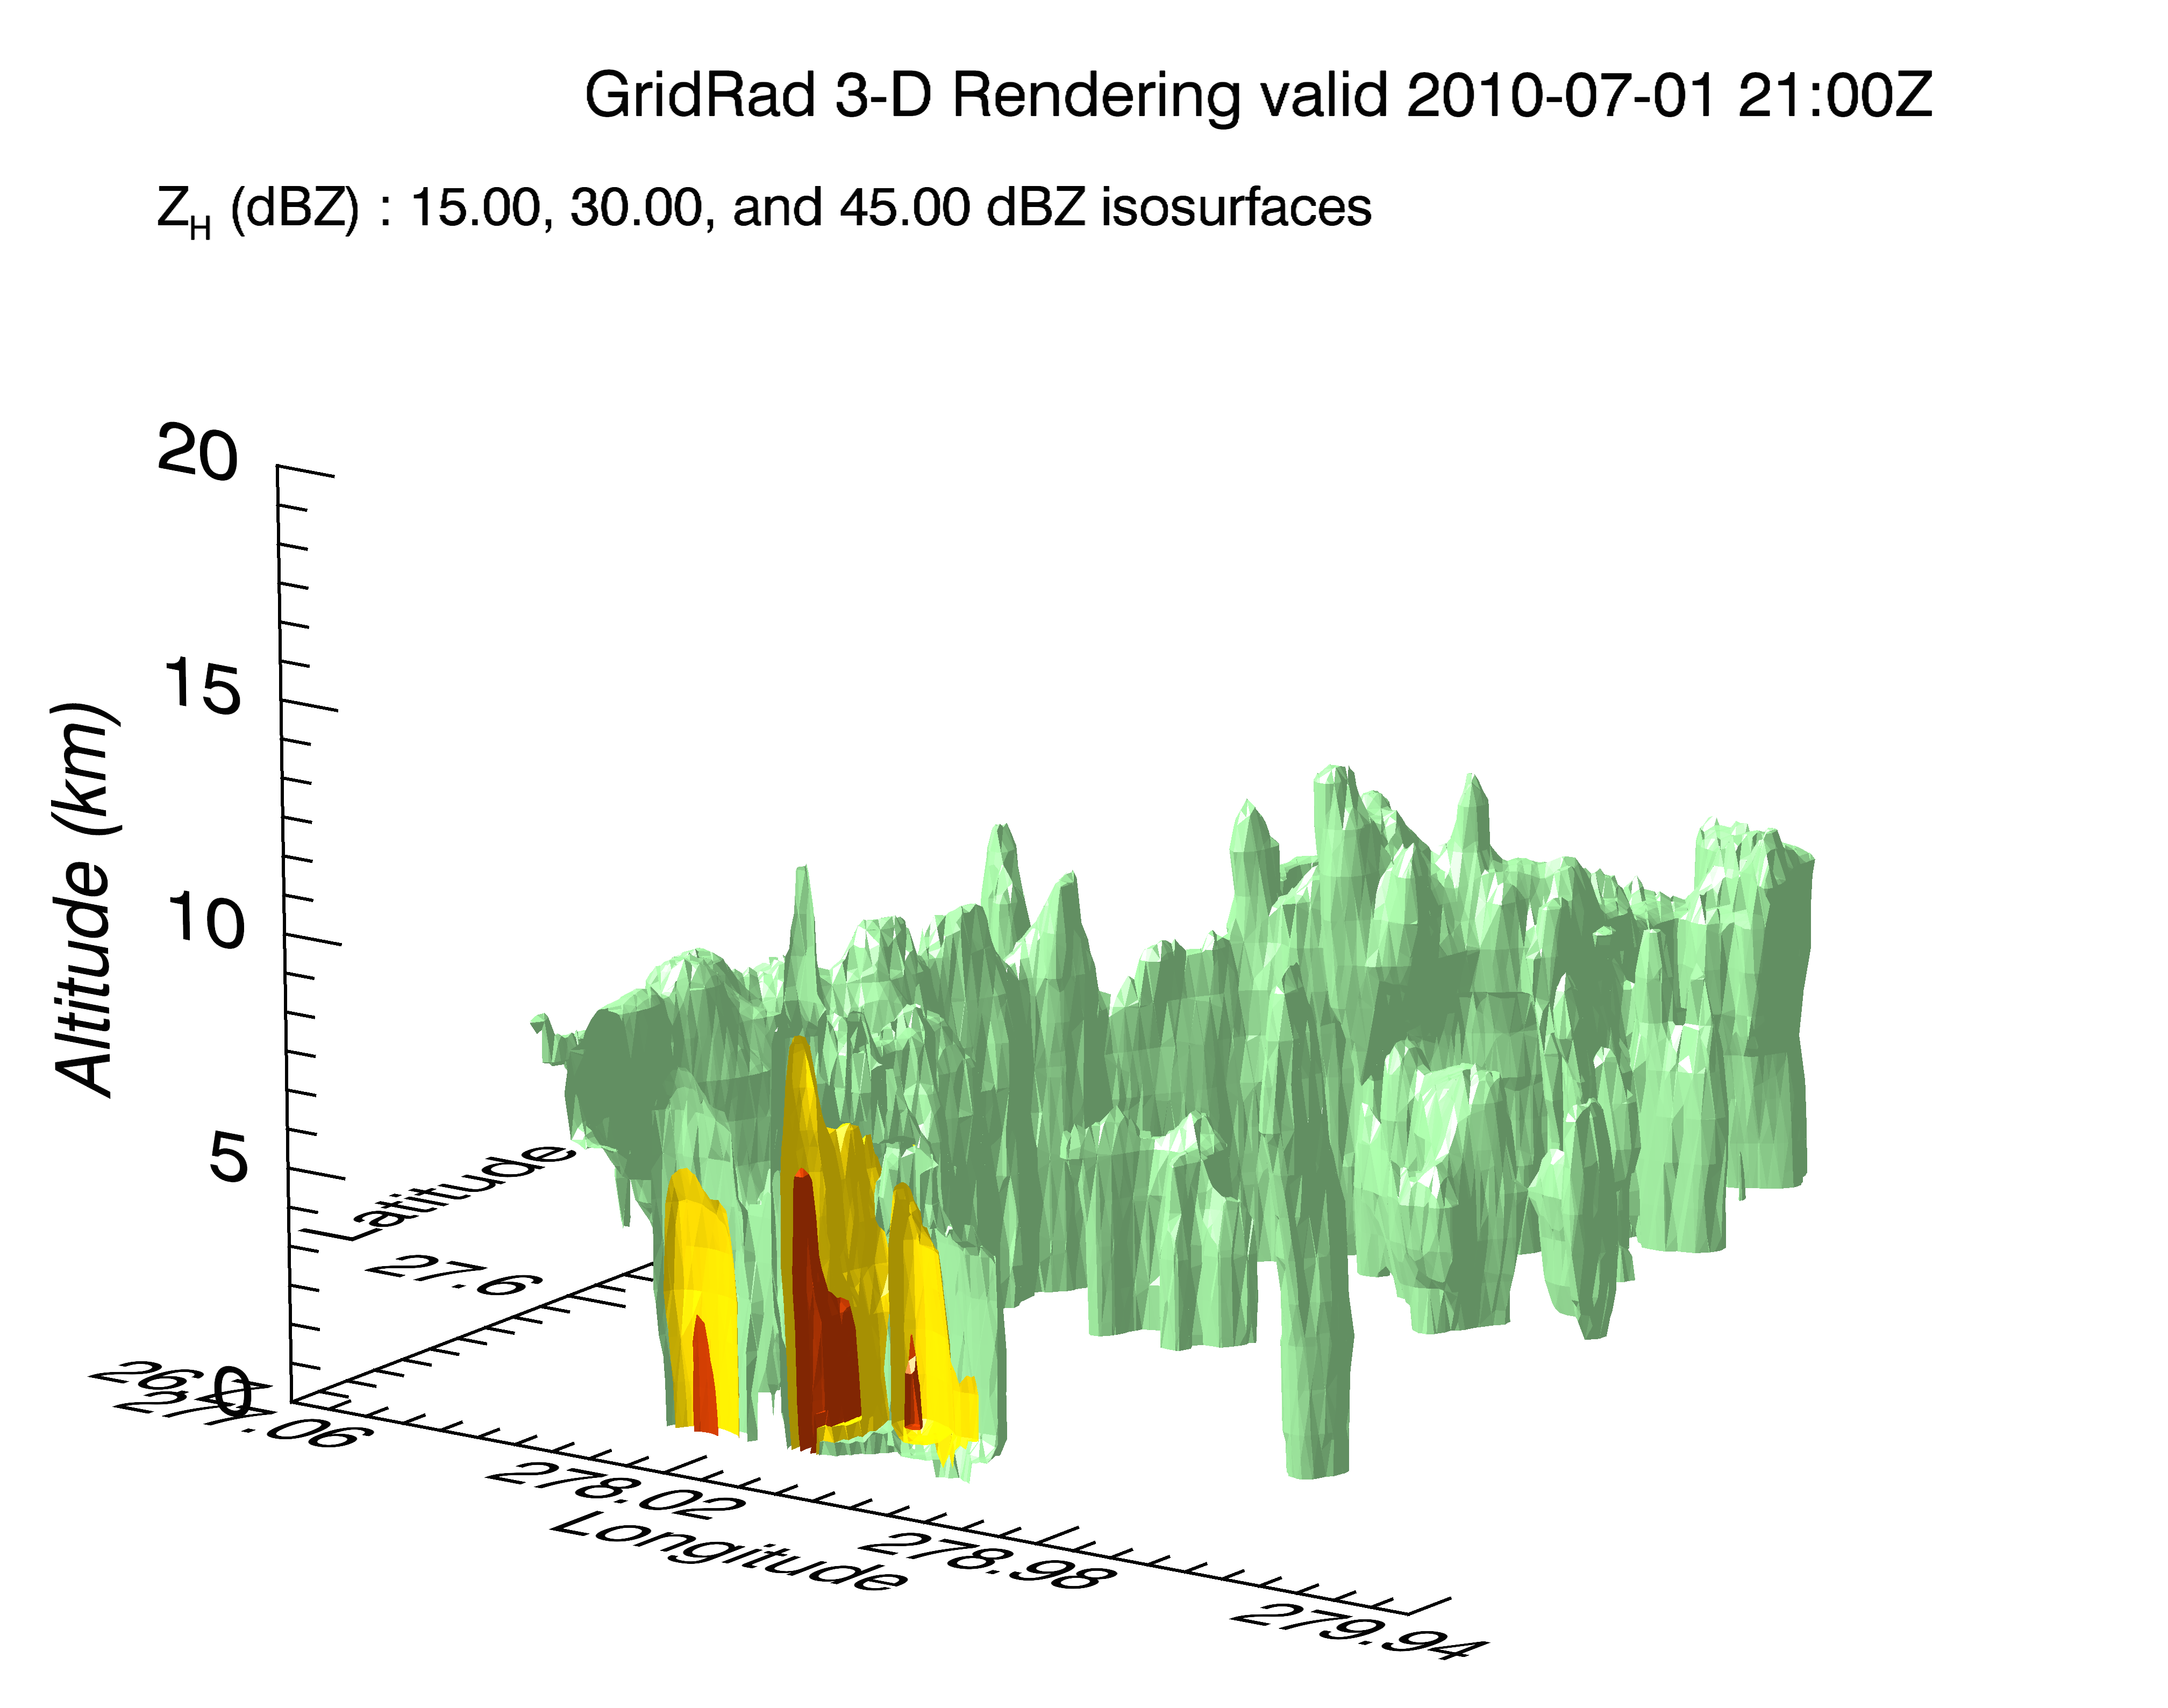
Example 3-D plot of ZH from 1 July 2010 at 21:00 UTC

Copyright © 2021 Cameron Homeyer